
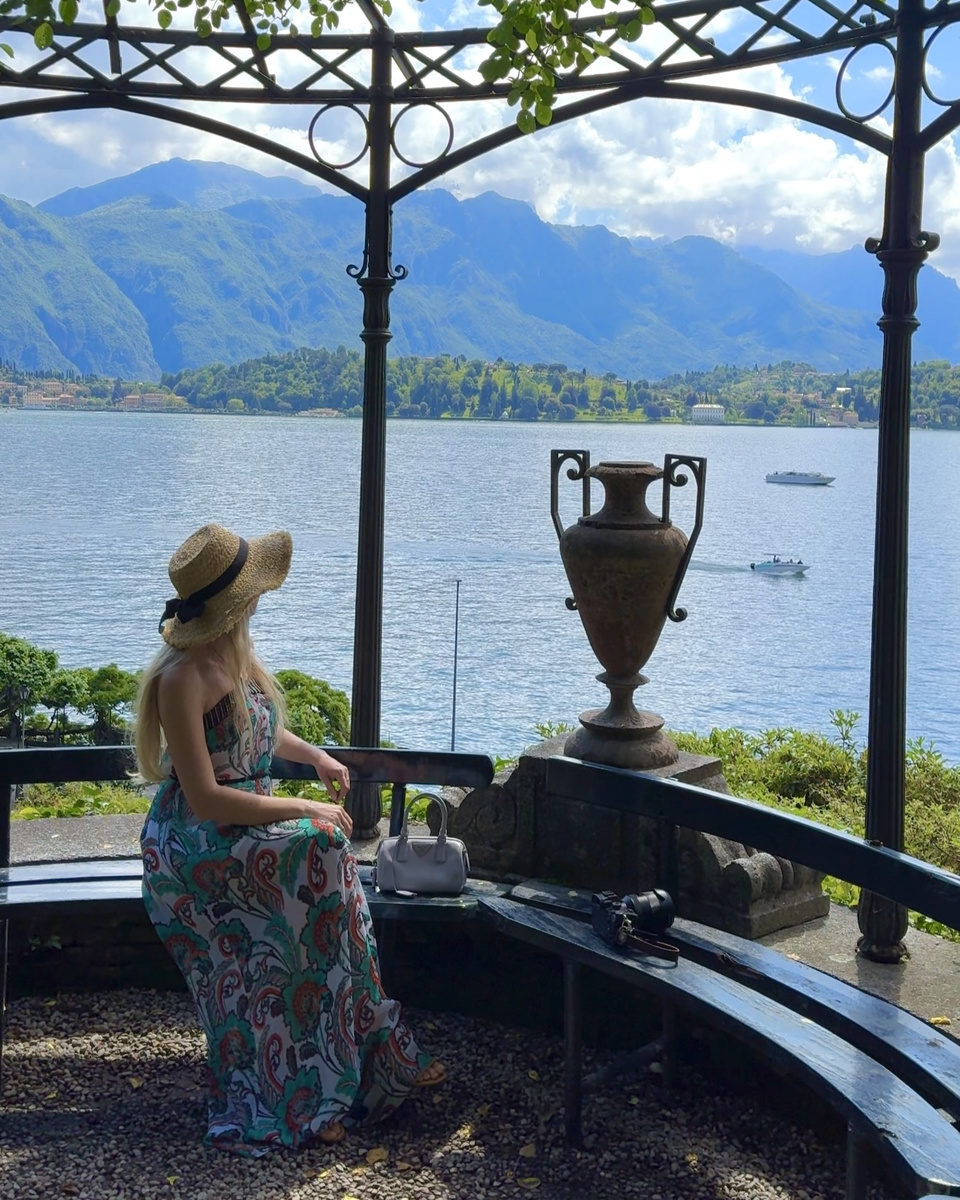
Spring blossom, rainy spells, summer water temperatures and the annual ferry changes all help determine which month deserves a reservation. Every travel influencer on Instagram seems to have a favorite month for Lake Como; I qualify on both counts, and my own photographs make a persuasive case for May—until you consider the photographs I never took. I spent two weeks there in the second half of May, and rain on about half my days spoiled most of the shoots I’d planned. The gaps in that album are more useful than its flattering remainder, because they expose what a polished month recommendation leaves out. The weather supplies most of the explanation; the ferry timetable, examined below, adds a late-autumn exception on 2 November 2026, when the arm you choose matters as much as the month.
For a first trip, I’d book June. The average daily high near Como is about 26 °C, or 79 °F. The evenings run long enough for the return boat, and the gardens still have roses. You can spend the day in Varenna and come back to dinner with daylight left, which gives you an excursion rather than an exercise in chasing the clock. If the purpose of your holiday is a morning swim in the water every day, though, choose July, with August just as reasonable, and accept the crowds as part of that decision. The change in the water between May and August gives those crowds a good case; they are voting for the months when the lake finally joins the holiday.
What May Photographs Leave Out
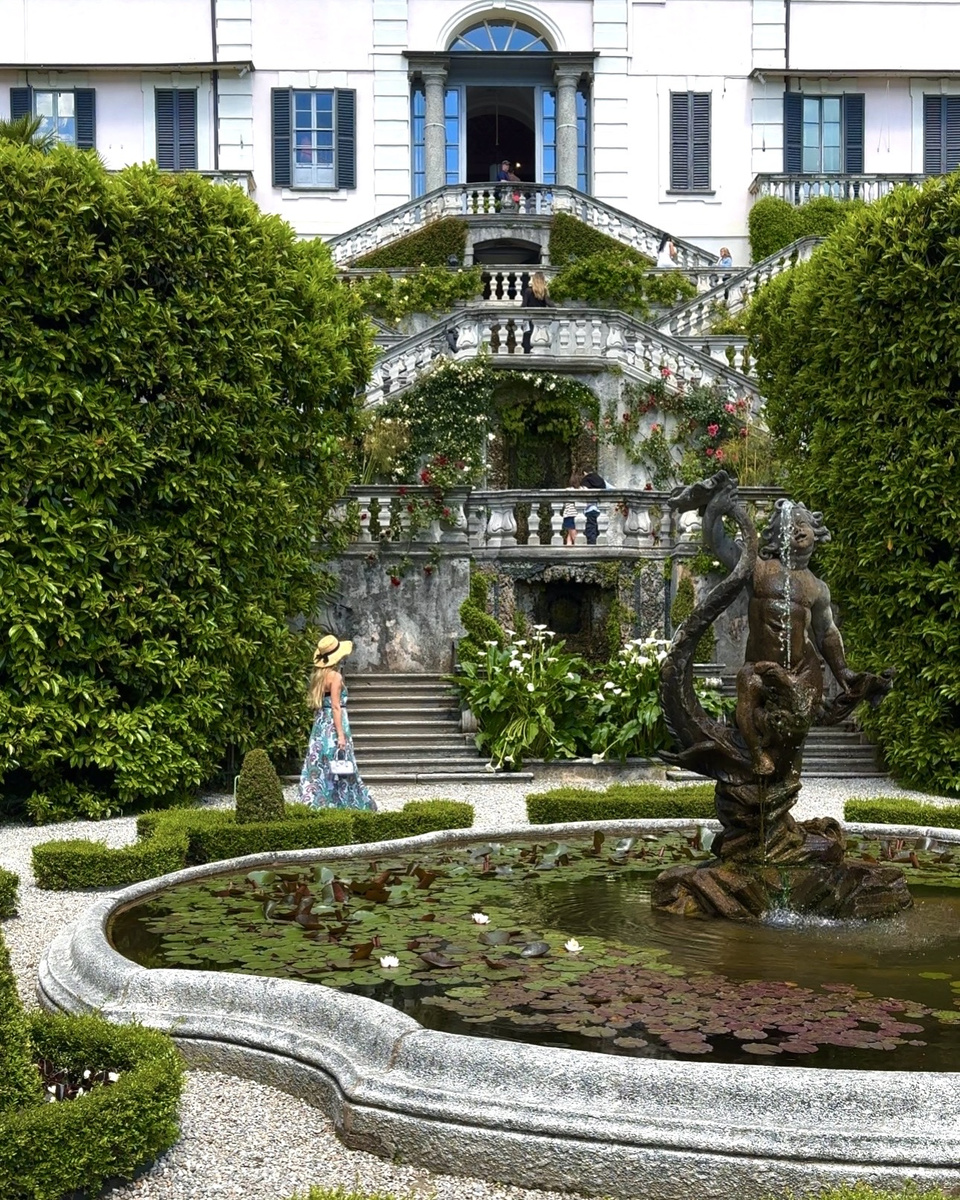
Villa Carlotta supplies a more precise answer about when to go, because its flowering calendar refuses to flatten itself into “spring.” The great rhododendrons are generally in full bloom between the middle of March and the middle of April; the azaleas follow in April and May, during a brief display that gardeners work toward all year. For someone who wants that particular photograph, April has a claim that a week of perfect July weather never matches; even within spring, arriving in late May for a garden you saw on Instagram in April is a gamble. The flowers you want, rather than the broad season printed at the top of a booking page, set the terms.
Why not simply choose a date and hope? Because a second gamble hides inside the first: you are reserving not only a month but a particular day, and the model gives you no promise about that day. In weather models for 1991–2020 near Como, the second half of May averaged six or seven days with at least a millimeter of precipitation. A shower after dinner contributes as much to that tally as a wet afternoon, although the two have different consequences for you: one leaves the daylight largely intact, while the other can consume it.
In my own fortnight, the timing of the rain determined which plans survived. June offers longer days and more warmth while retaining much the same frequency of wet ones. The practical consequence of those missing May photographs is this: I’d keep two possible days free for the garden I most wanted to photograph, which gives you a second chance if the first forecast lets you down.
Why People Come in Summer
Consider what “warm” means on a terrace, then what it means on the bottom rung of a swimming ladder. How far apart those two meanings are in May! Daily highs near Como average about 22 °C, or 72 °F, while Eawag’s model for 2016–2025 puts the average water temperature a meter below the surface at about 13 °C, or 56 °F. It’s entirely possible to enjoy lunch outside and take an altogether different view of getting in; I find that distinction more useful than any unqualified promise of spring warmth. The air temperature describes conditions on shore, but it says little about what awaits you once you leave it.
By June, the water averages close to 20 °C—about 67 °F—and the seasonal rise continues to about 24 °C—about 74 °F—in July, then about 25 °C—77 °F—in August. Each figure changes the proposition for you, because it describes the element you enter rather than the air in which you linger. July also records less total rainfall than either May or June in both historical weather models I examined, so its case rests on more than the thermometer. A holiday built around a daily swim, time on a boat and dinner outdoors therefore makes good sense in July. Choosing June for a first trip involves a deliberate trade: some water warmth for a little more room ashore, which matters if you want the lake without arranging every hour around peak demand.
Lake Como weather by month
Compare average daily highs, lake temperatures and wet days.
Temperature (°C)
View the numbers
| Measure | Value (°C) |
|---|---|
| Jan — Average daily high | 7.9 |
| Jan — Water at 1 meter | 8.3 |
| Feb — Average daily high | 9.7 |
| Feb — Water at 1 meter | 7.6 |
| Mar — Average daily high | 14.3 |
| Mar — Water at 1 meter | 7.8 |
| Apr — Average daily high | 17.8 |
| Apr — Water at 1 meter | 9.4 |
| May — Average daily high | 22.1 |
| May — Water at 1 meter | 13.4 |
| Jun — Average daily high | 26.3 |
| Jun — Water at 1 meter | 19.7 |
| Jul — Average daily high | 28.7 |
| Jul — Water at 1 meter | 23.6 |
| Aug — Average daily high | 28 |
| Aug — Water at 1 meter | 24.9 |
| Sep — Average daily high | 23 |
| Sep — Water at 1 meter | 22.5 |
| Oct — Average daily high | 17.5 |
| Oct — Water at 1 meter | 18.2 |
| Nov — Average daily high | 12.1 |
| Nov — Water at 1 meter | 13.9 |
| Dec — Average daily high | 8.3 |
| Dec — Water at 1 meter | 10.2 |
Temperature (°F)
View the numbers
| Measure | Value (°F) |
|---|---|
| Jan — Average daily high | 46.2 |
| Jan — Water at 1 meter | 46.9 |
| Feb — Average daily high | 49.5 |
| Feb — Water at 1 meter | 45.7 |
| Mar — Average daily high | 57.7 |
| Mar — Water at 1 meter | 46 |
| Apr — Average daily high | 64 |
| Apr — Water at 1 meter | 48.9 |
| May — Average daily high | 71.8 |
| May — Water at 1 meter | 56.1 |
| Jun — Average daily high | 79.3 |
| Jun — Water at 1 meter | 67.5 |
| Jul — Average daily high | 83.7 |
| Jul — Water at 1 meter | 74.5 |
| Aug — Average daily high | 82.4 |
| Aug — Water at 1 meter | 76.8 |
| Sep — Average daily high | 73.4 |
| Sep — Water at 1 meter | 72.5 |
| Oct — Average daily high | 63.5 |
| Oct — Water at 1 meter | 64.8 |
| Nov — Average daily high | 53.8 |
| Nov — Water at 1 meter | 57 |
| Dec — Average daily high | 46.9 |
| Dec — Water at 1 meter | 50.4 |
Wet days
View the numbers
| Measure | Value (days) |
|---|---|
| Jan — Days with at least 1 mm of precipitation | 6.6 |
| Feb — Days with at least 1 mm of precipitation | 7 |
| Mar — Days with at least 1 mm of precipitation | 8.4 |
| Apr — Days with at least 1 mm of precipitation | 12.1 |
| May — Days with at least 1 mm of precipitation | 13.5 |
| Jun — Days with at least 1 mm of precipitation | 12.9 |
| Jul — Days with at least 1 mm of precipitation | 11.3 |
| Aug — Days with at least 1 mm of precipitation | 12.4 |
| Sep — Days with at least 1 mm of precipitation | 10.4 |
| Oct — Days with at least 1 mm of precipitation | 10.7 |
| Nov — Days with at least 1 mm of precipitation | 10.6 |
| Dec — Days with at least 1 mm of precipitation | 7.3 |
The difference shows up in the beds. The June 2024 total for the provinces of Como and Lecco combined came to about 721,000 guest nights across every category of lodging; July passed a million, and August reached nearly 1.09 million. Those figures don’t count everyone who shares the waterfront with you. Both provinces extend inland, and a day-tripper from Milan leaves no trace in them, which means they capture neither a pure lakeside measure nor the whole daytime crowd. Still, they explain a small comedy of perspective: you find June lively, and the hotelier hears you, thinks of the totals that follow, and answers silently, wait until August.
Money presents a similar picture: by my calculation from the Bank of Italy’s international travel survey, visitors from abroad spent an estimated €224 million in Como province in July 2025, €217 million in August and €172 million in September. July and August were the two strongest months in each of the three years from 2023 to 2025, which gives the peak a sturdier basis than one busy season. The comparison needs a caveat, since a pair of expensive rooms can account for as much spending as a whole floor of modest ones. It does not predict the rate on your booking screen; for anyone trying to reserve a room, though, it makes September worth a closer look.
When visitors come to Como
July and August lead on both measures.
Overnight stays
View the numbers
| Measure | Value (guest nights) |
|---|---|
| Jan — Guest nights | 113,683 |
| Feb — Guest nights | 129,926 |
| Mar — Guest nights | 249,253 |
| Apr — Guest nights | 476,457 |
| May — Guest nights | 722,666 |
| Jun — Guest nights | 721,048 |
| Jul — Guest nights | 1,020,617 |
| Aug — Guest nights | 1,085,938 |
| Sep — Guest nights | 743,943 |
| Oct — Guest nights | 481,331 |
| Nov — Guest nights | 195,059 |
| Dec — Guest nights | 174,761 |
Visitor spending
View the numbers
| Measure | Value (€ million) |
|---|---|
| Jan — Spending by visitors resident abroad | 53.5 |
| Feb — Spending by visitors resident abroad | 79.4 |
| Mar — Spending by visitors resident abroad | 70.1 |
| Apr — Spending by visitors resident abroad | 152.8 |
| May — Spending by visitors resident abroad | 158.1 |
| Jun — Spending by visitors resident abroad | 183.9 |
| Jul — Spending by visitors resident abroad | 224 |
| Aug — Spending by visitors resident abroad | 217.2 |
| Sep — Spending by visitors resident abroad | 172 |
| Oct — Spending by visitors resident abroad | 135.4 |
| Nov — Spending by visitors resident abroad | 52.2 |
| Dec — Spending by visitors resident abroad | 81.6 |
September Suits a Swimmer. October Suits a Different Photographer.
September turns May’s swimming-ladder problem inside out. The daily high averages about 23 °C, or 73 °F, and the water averages about 22.5 °C—again 73 °F—because the lake has had all summer to warm up. May’s 13 °C reading now has a pleasurable consequence: it marks the spring comparison against which September’s balance feels so generous, letting you swim and then walk without July’s heat instead of asking you to choose between comfort on land and comfort in the water. The count of rainy days tends to come in below the totals for May and June, although September’s total rainfall sometimes matches either of theirs. For a swim followed by that walk, this is the month I’d choose; it suits the whole day rather than one glorious hour of it.
Garden photography asks something different of you. The great spring flowering is over, and I’d wait for the deciduous trees to turn before making a trip for autumn color, since neither the absent spring display nor an unturned canopy answers that brief. An inexpensive hotel room is not a dependable prize the moment August ends. In the Italian Hotel Monitor’s sample of upscale, year-round hotels in Como city, September 2025 occupancy was just over 89 percent, higher than in either July or August; across the two provinces, September’s count of nights spent by hotel guests nearly matched June’s in 2024. Those facts collide only if you assume that space on a promenade and space in a hotel inventory are the same thing. They are not: you can find more elbow room along the water and still fail to secure the hotel you want, which is why the reservation deserves its own check rather than an inference from the waterfront.
October changes the bargain again. For the color in the woods above the lake, I’d take the cooler days, with an average high around 17.5 °C, or 64 °F, and leave some leeway for rain. I’d also pay attention to which arm of the lake my hotel faces, because the date on which a boat disappears from the timetable matters more than a degree or two on the thermometer. A pleasant afternoon tells you whether to carry another layer; it tells you nothing about whether the boat you intended to catch still exists.
The Last Boat on the Lecco Arm
On a map, Lecco and Como sit at the feet of their respective arms with a symmetry that winter promptly ruins. How completely the map conceals a booking problem! In 2026, the summer timetable ran through 4 October, while the autumn timetable still carried passengers between Lecco and Bellagio through 1 November. The 2 November exception promised at the outset now acquires its practical meaning: the winter timetable began, and the Lecco–Bellagio service disappeared. Boats continued from Como, and the central ferries still linked Bellagio, Varenna, Menaggio and Cadenabbia, so the lake did not close; one convenient proposition did. For a day trip from Milan, that distinction gives the choice of train destination enormous weight, because it determines which boats remain available to you after the timetable turns.
Americans meet the season even earlier in the planning process, because the flight pattern thins out before anyone reaches a landing stage. In 2025, US Department of Transportation figures showed an average of about ten nonstop passenger flights a day from the United States to Milan Malpensa in June, slightly more than nine in September and under five in January. A quiet January stay in Como city has its pleasures, but it demands a different set of reservations from a summer itinerary built around exploring the lake by ferry. The flight schedule and the boat schedule belong in the same deliberation, not in separate browser tabs, since each one shapes what the other makes possible.
Nonstop flights from the US by month
In 2025, twice as many flights served Milan Malpensa in June as in January.
Milan Malpensa
View the numbers
| Measure | Value (flights) |
|---|---|
| Jan — Milan Malpensa | 142 |
| Feb — Milan Malpensa | 136 |
| Mar — Milan Malpensa | 187 |
| Apr — Milan Malpensa | 230 |
| May — Milan Malpensa | 259 |
| Jun — Milan Malpensa | 301 |
| Jul — Milan Malpensa | 292 |
| Aug — Milan Malpensa | 290 |
| Sep — Milan Malpensa | 279 |
| Oct — Milan Malpensa | 269 |
| Nov — Milan Malpensa | 191 |
| Dec — Milan Malpensa | 177 |
Zurich
View the numbers
| Measure | Value (flights) |
|---|---|
| Jan — Zurich | 397 |
| Feb — Zurich | 367 |
| Mar — Zurich | 458 |
| Apr — Zurich | 483 |
| May — Zurich | 566 |
| Jun — Zurich | 570 |
| Jul — Zurich | 606 |
| Aug — Zurich | 607 |
| Sep — Zurich | 533 |
| Oct — Zurich | 516 |
| Nov — Zurich | 434 |
| Dec — Zurich | 462 |
If you’re sitting at home in January trying to settle on a week, put one question ahead of the booking engine: what do you want the trip to ask of the lake? Is it the azaleas at Carlotta? Go in spring and give Carlotta’s grounds more than one afternoon, because the brief display and the rainy-day tally reward a reserve day more than they reward optimism. Is it a swim before breakfast? Let the water warm up, and judge it by the ladder rather than by the terrace. If you want a little of everything, June remains my answer, since it leaves roses, long evenings, a boat ride and a plausible swim in the same frame without insisting that any one of them carries the whole holiday.
And if you already have the last week of July booked? Well, yes: keep it! Expect company at the landing stage, but expect a lake you want to get into, too. The crowd has not stumbled into the wrong season; it has read the water correctly.